
B2B Marketers are soon going to be able to ride the wave. Wave Analytics for B2B Marketing will help you visualize all the data in your Pardot, CRM, and even third party sources. You can view this data on your computer, tablet, and smartphone. This data will help you maximize ROI and effectiveness of your marketing campaigns. Not to mention, the dashboards are all interactive and gives you the ability to make data-driven decisions quickly. Here are a sneak peak to exciting features:
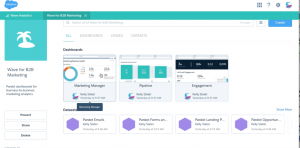
1. Marketing Manager Dashboard
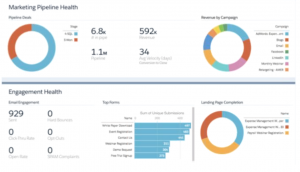
If you are a Marketing Manager, you are going to LOVE this dashboard. At first, it shows you a high level of relevant data regarding the health of your company and the ability to filter by time period. The two main views are Marketing Pipeline Health and Engagement Health. Marketing Pipeline health shows Pipeline Deals and Revenue by Campaign. The Engagement health shows email engagement, top forms and landing page completions.
2. Pipeline Dashboard
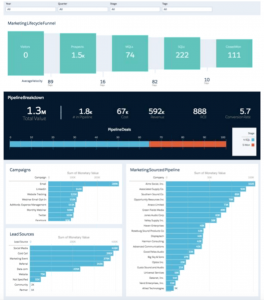
This dashboard will provide you a full, end-to-end view of your marketing pipeline. The five main things you will see in this dashboard is the Marketing Lifecycle funnel, Pipeline Breakdown, top Marketing Campaigns, Marketing source pipeline, and Lead sources. The amazing aspect of this dashboard is the ability to view prospect-specific data.
3. Engagement Dashboards
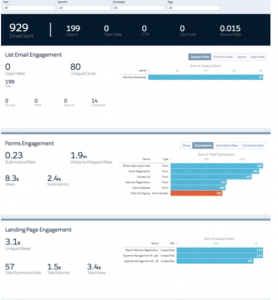
Time to see how your prospects are interacting and engaging with your content, all in one place. This dashboard allows you to explore marketing engagement data. The top three marketing assets you will see is email engagement, form engagement, and landing page engagement. The exciting thing about this dashboard is it allows users to view responses and engagement with individual assets so you can tie this to sales results
4. Creating Datasets
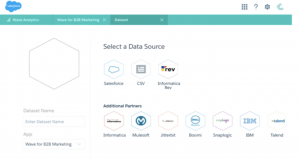
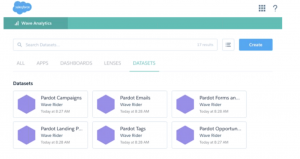
The datasets that already include source data from Pardot like campaigns, emails, forms & form handlers, landing pages, tags, and Pardot opportunities. You have the capability to pull data from Salesforce, CSV files, Informatica Rev and other third-party sources.
5. Visualization
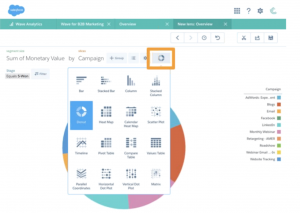
This is a cool feature in the Wave platform that allows you to view your data in 16 different displays. How you like your data displayed? Bars, Columns, Donut (Glazed or Sprinkled), Heat Map, Scatter, Timeline, Tables, etc.
6. Customizing “Lenses”
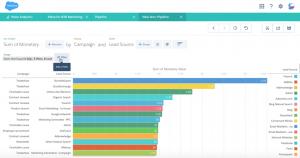
A lens is an individual report you want to see. Each individual report on a dashboard you can view as a lens. This is my favorite part of wave to ride. It gives you the ability to see data from every angle. An aggregation is action required in starting to build your customized lens. It allows you summarize quantitative data based on groupings (Count, Sum, Min, Max,Avg). Next, you can group by dates or dimension (qualitative data) like campaigns and stages. You can also add additional groupings which adds colors to the chart. Lastly, you have the option to filter by opportunity stages,fiscal year, fiscal quarter, or Pardot tags.
Side Note: Groups and filters are optional
The example below shows the monetary value (aggregation) grouped by how campaigns are doing by lead source (colored), and filtered by SQL’s, opportunities won and opportunities lost.
7. Ability to share data
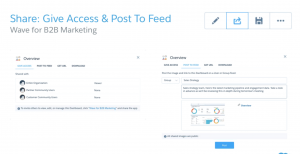
Once you create a dashboard or lens, you can share this data with whom you want to share it with. You have the ability to give access to certain people and/or groups, post it to chatter, get a URL of the data, or download a screenshot of it. Whether your boss wants to see certain data, you need data for a presentation, you want to share it with a different team, or you want to share with an individual you the capability to do this. If you’d like to learn more about Pardot, please visit our Salesforce page.
Wave for B2B Marketing is available to the public on October 17th.
[pardot-form id=”9912″ title=”Wordpress Form”]